
Maestro: Multi-Attribute Data Interpretation Platform
Maestro™ is an advanced visualization software platform developed to efficiently integrate and translate spatial attributes into accurate reservoir properties. It gives you the tools to dynamically combine all available data into logical categorizations, detailed predictions, and meaningful interpretations.
With Maestro, the entire team can collaborate in harmony, leveraging contextual data insights to make decisions with greater confidence and speed – and find hidden information in data you thought you knew.
Compose Your Own Original Arrangements
Maestro allows you to bring together data in dynamic and novel ways.
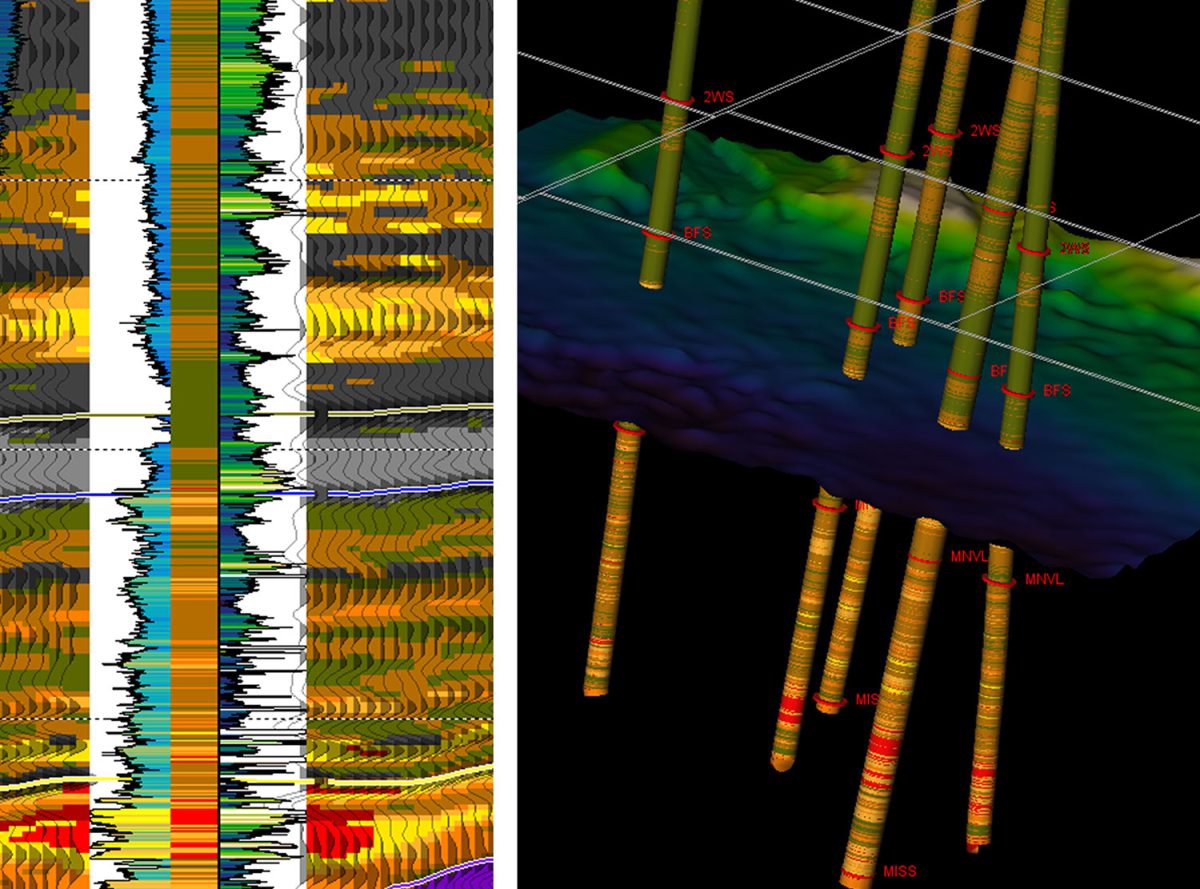
Well Data
Logs, borehole measurements,
mud logs, core, interactive composite classes.
Engineering
Reservoir & production data, interactive composite classes.
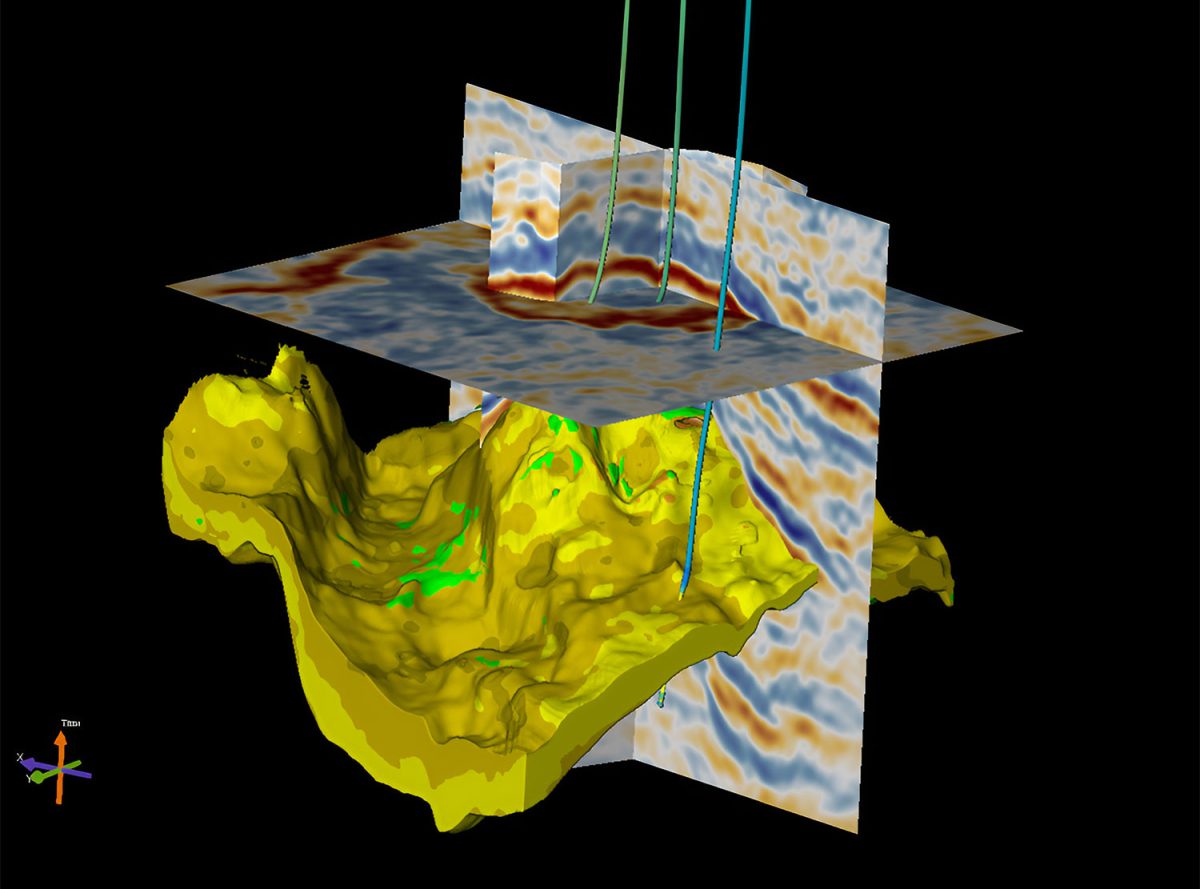
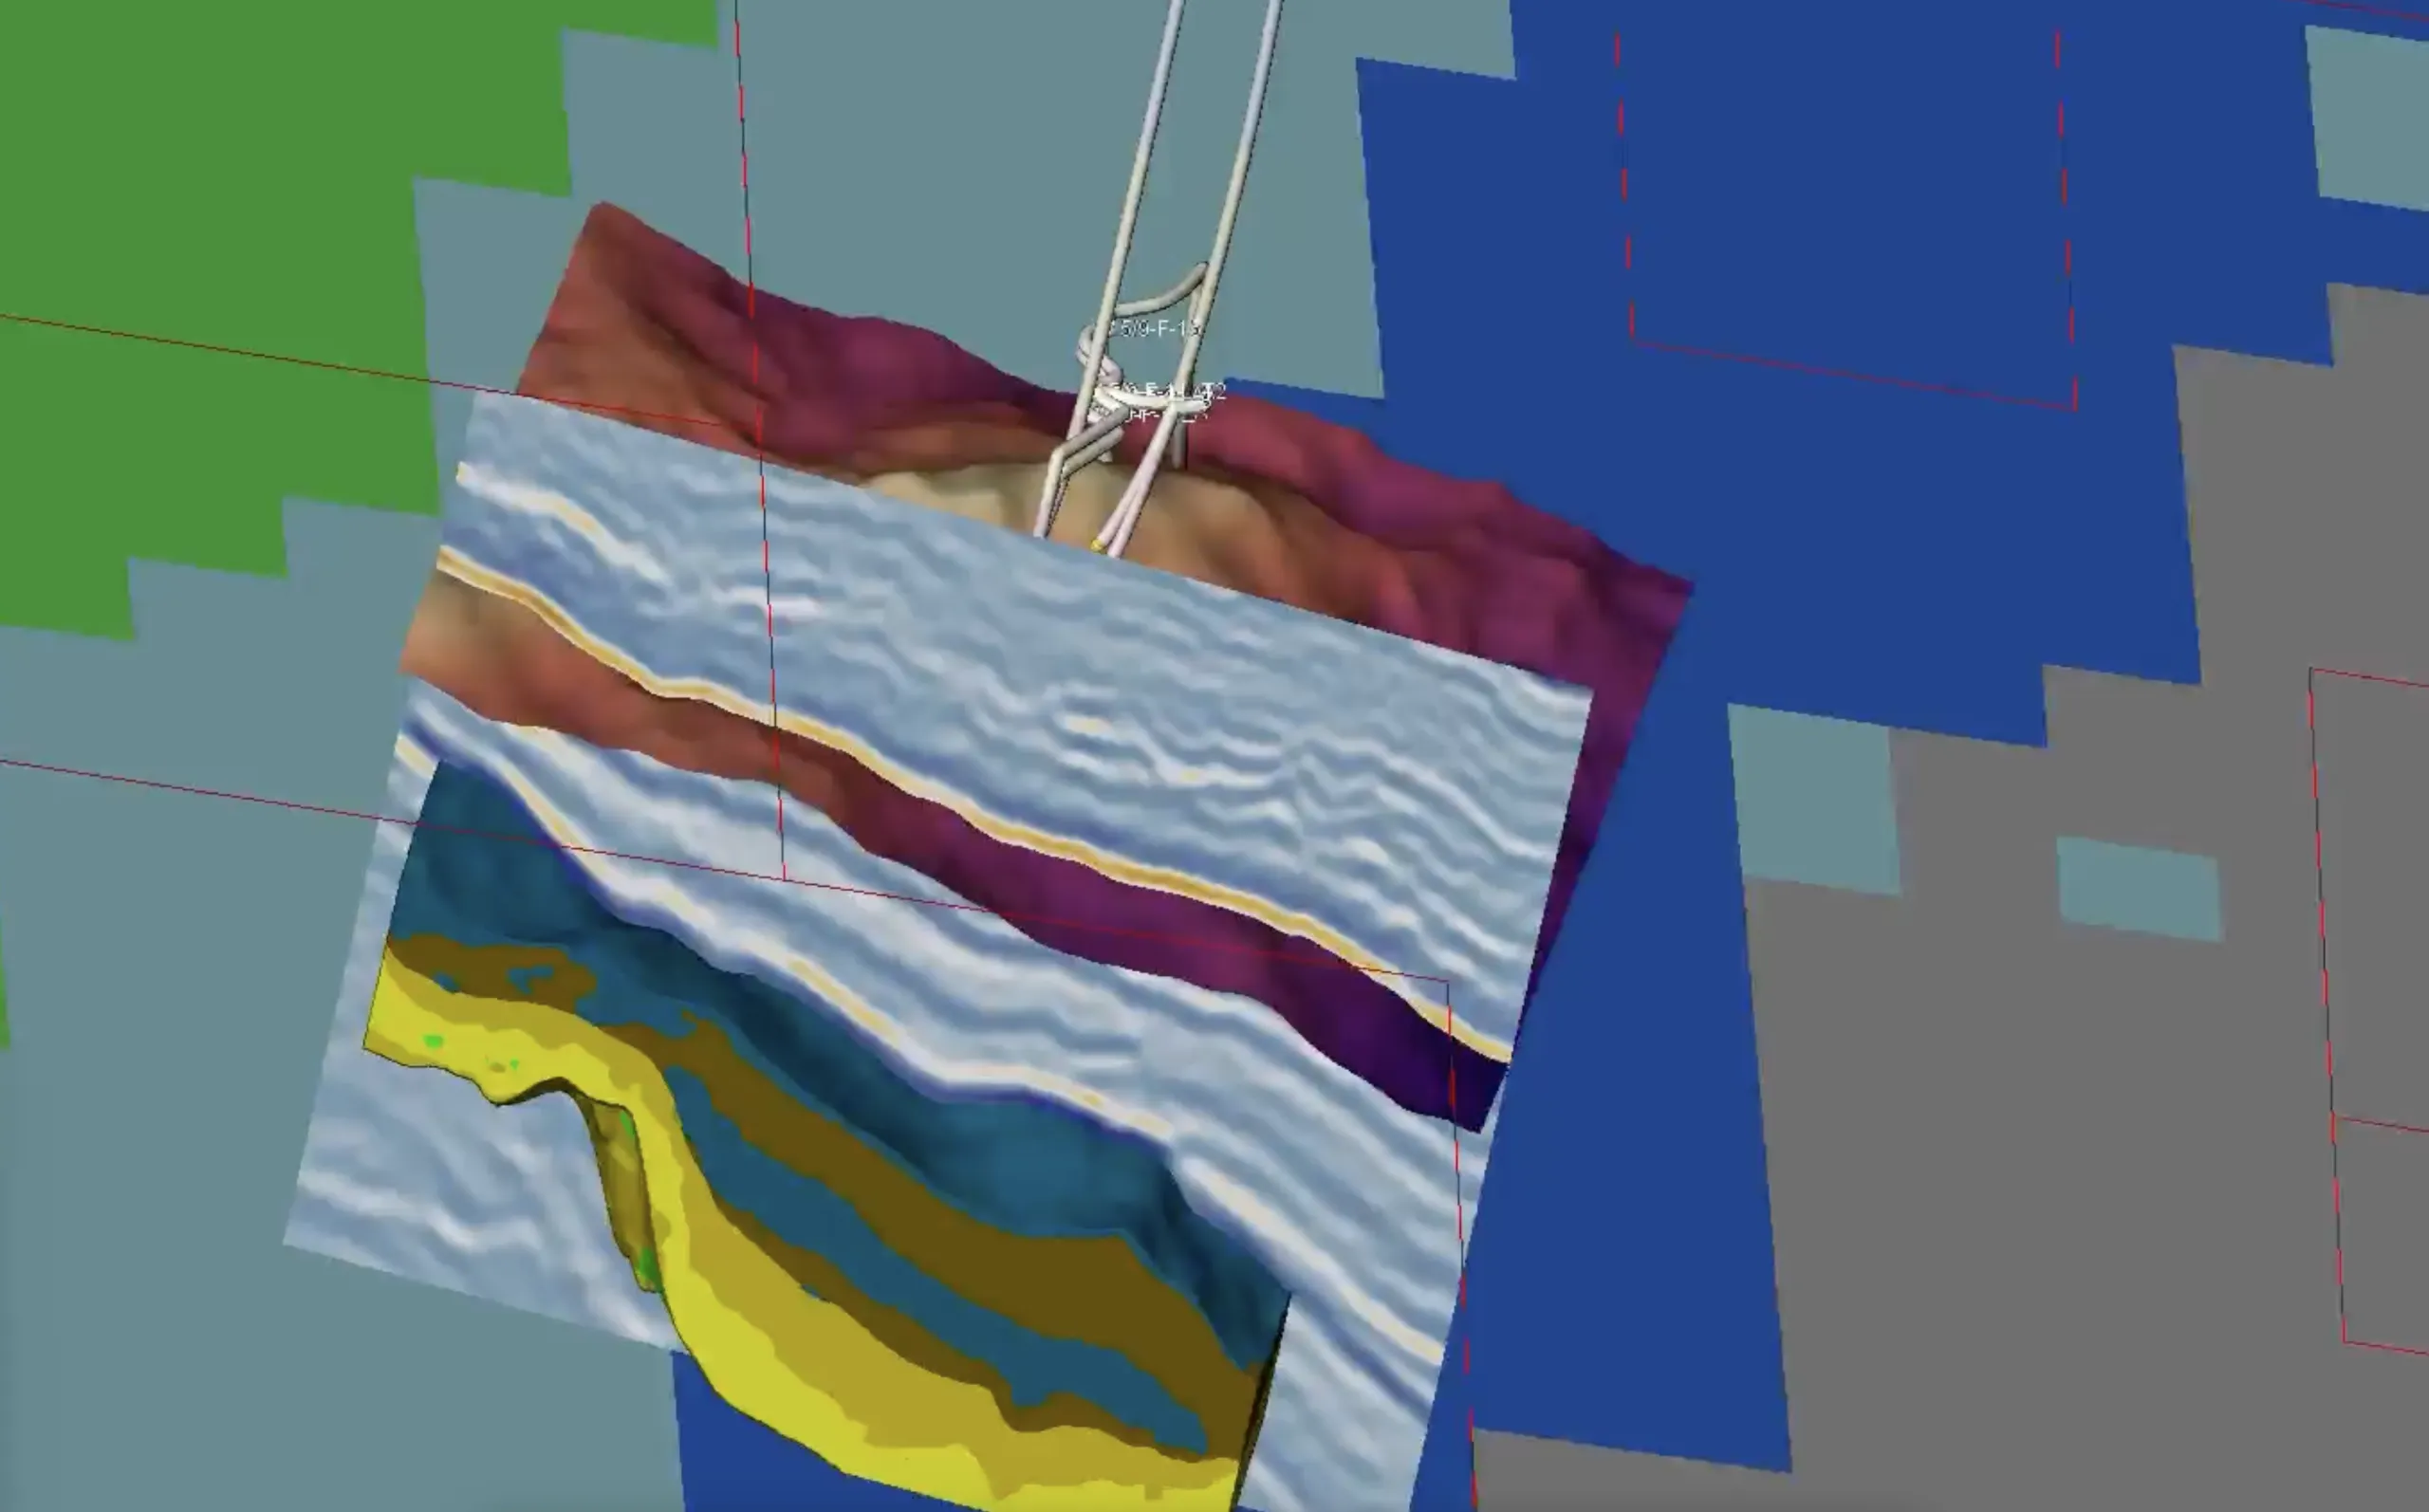
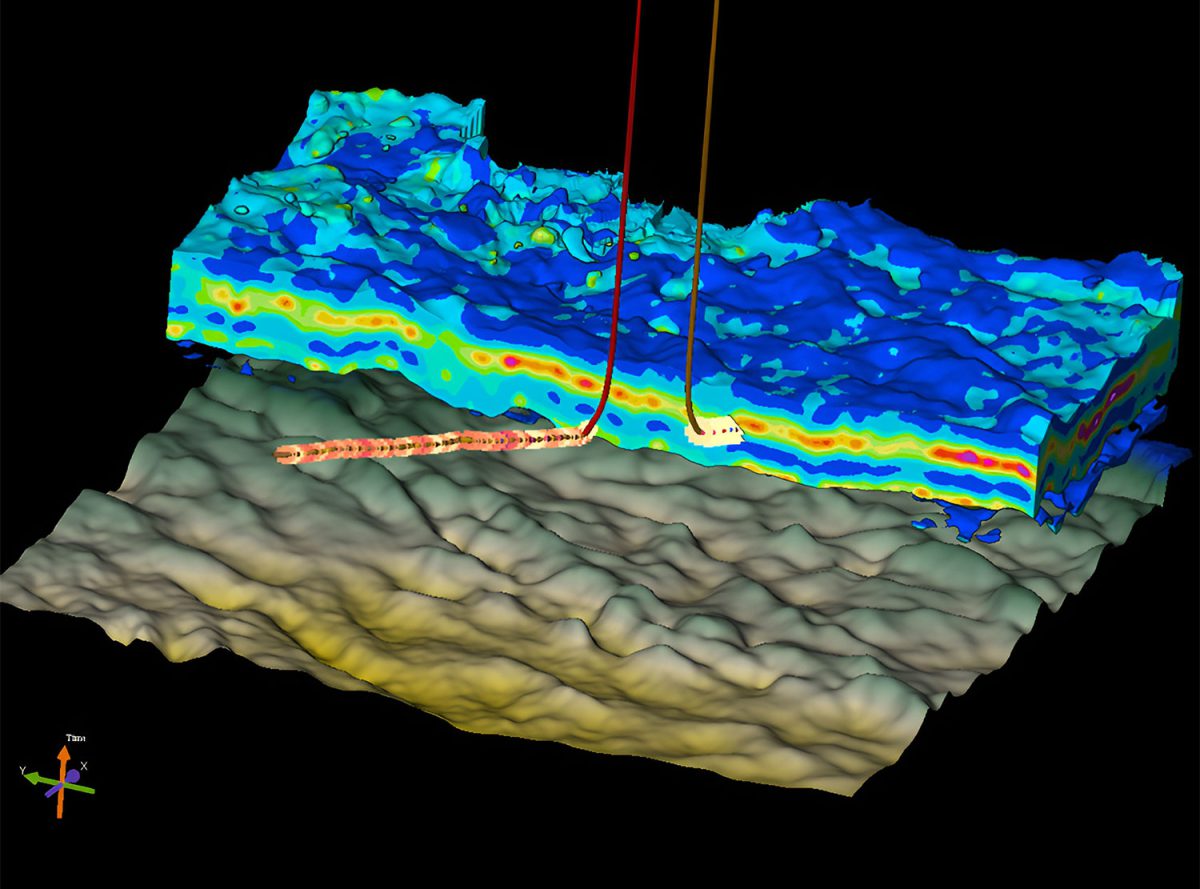
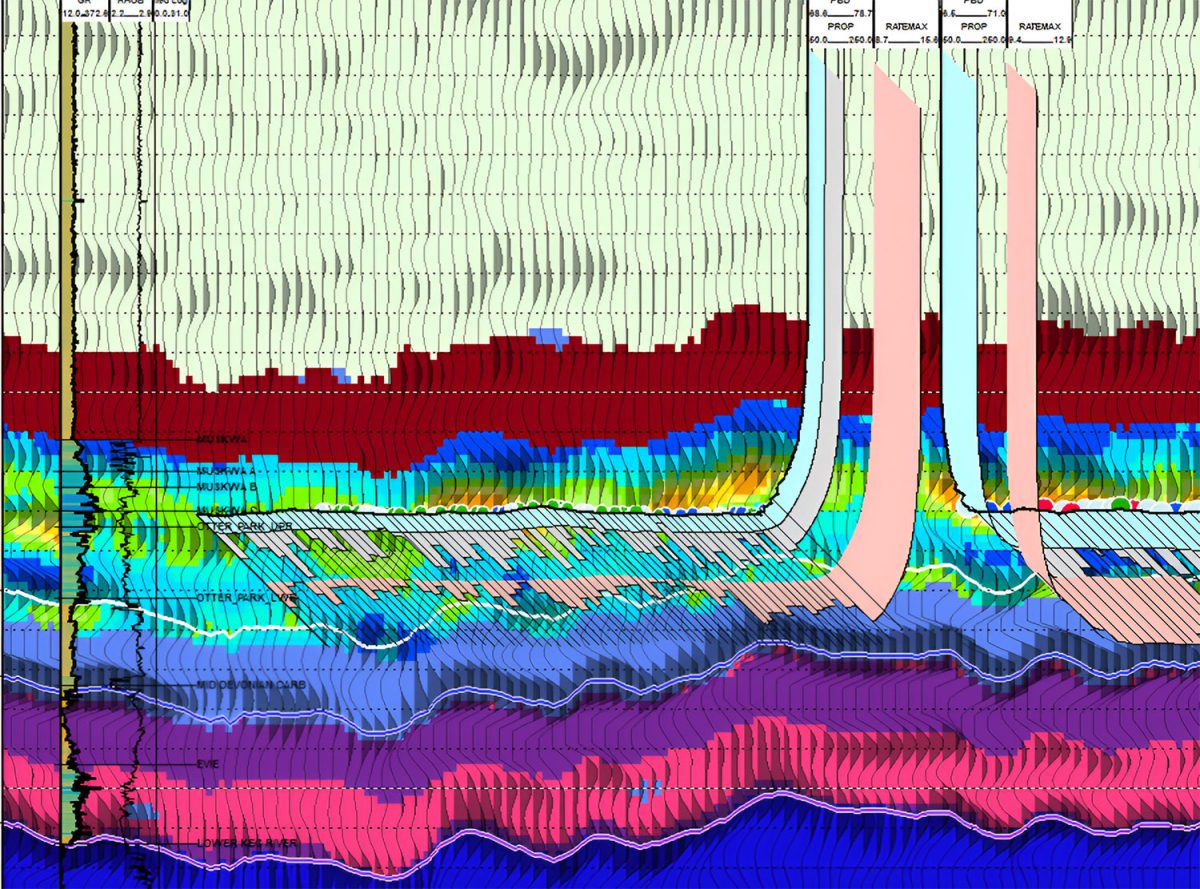
Seismic Data
2D, 3D, 4D, 3C, elastic, spectral, structural attributes. Interactive composite classes.
Drilling & Completion Data
Operational & geomechanical data. Interactive composite classes.
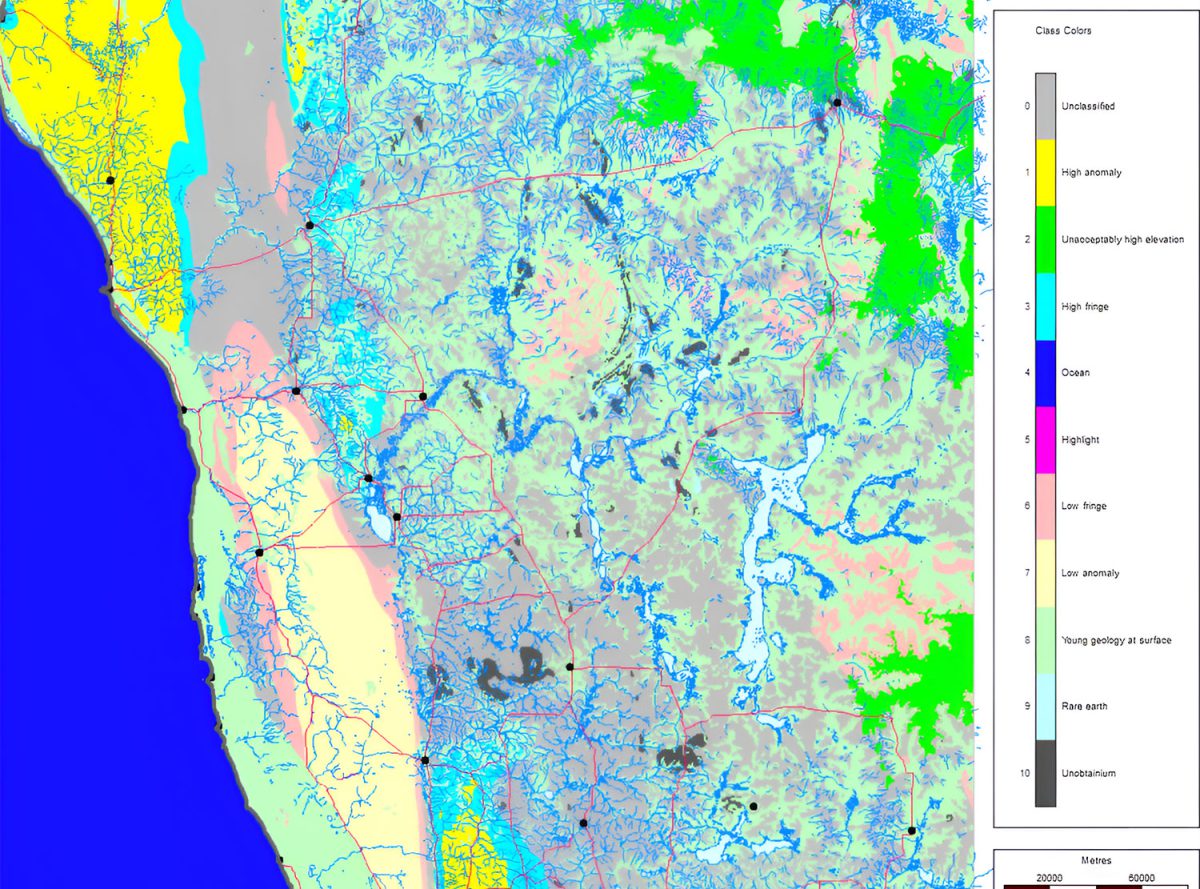
Map Classification
Gridded maps overlain and investigated. Interactive classification of intersecting features.

Spatial Points
3D point data displayed by
colour and size with interactive multi-value classification.
How Maestro Works
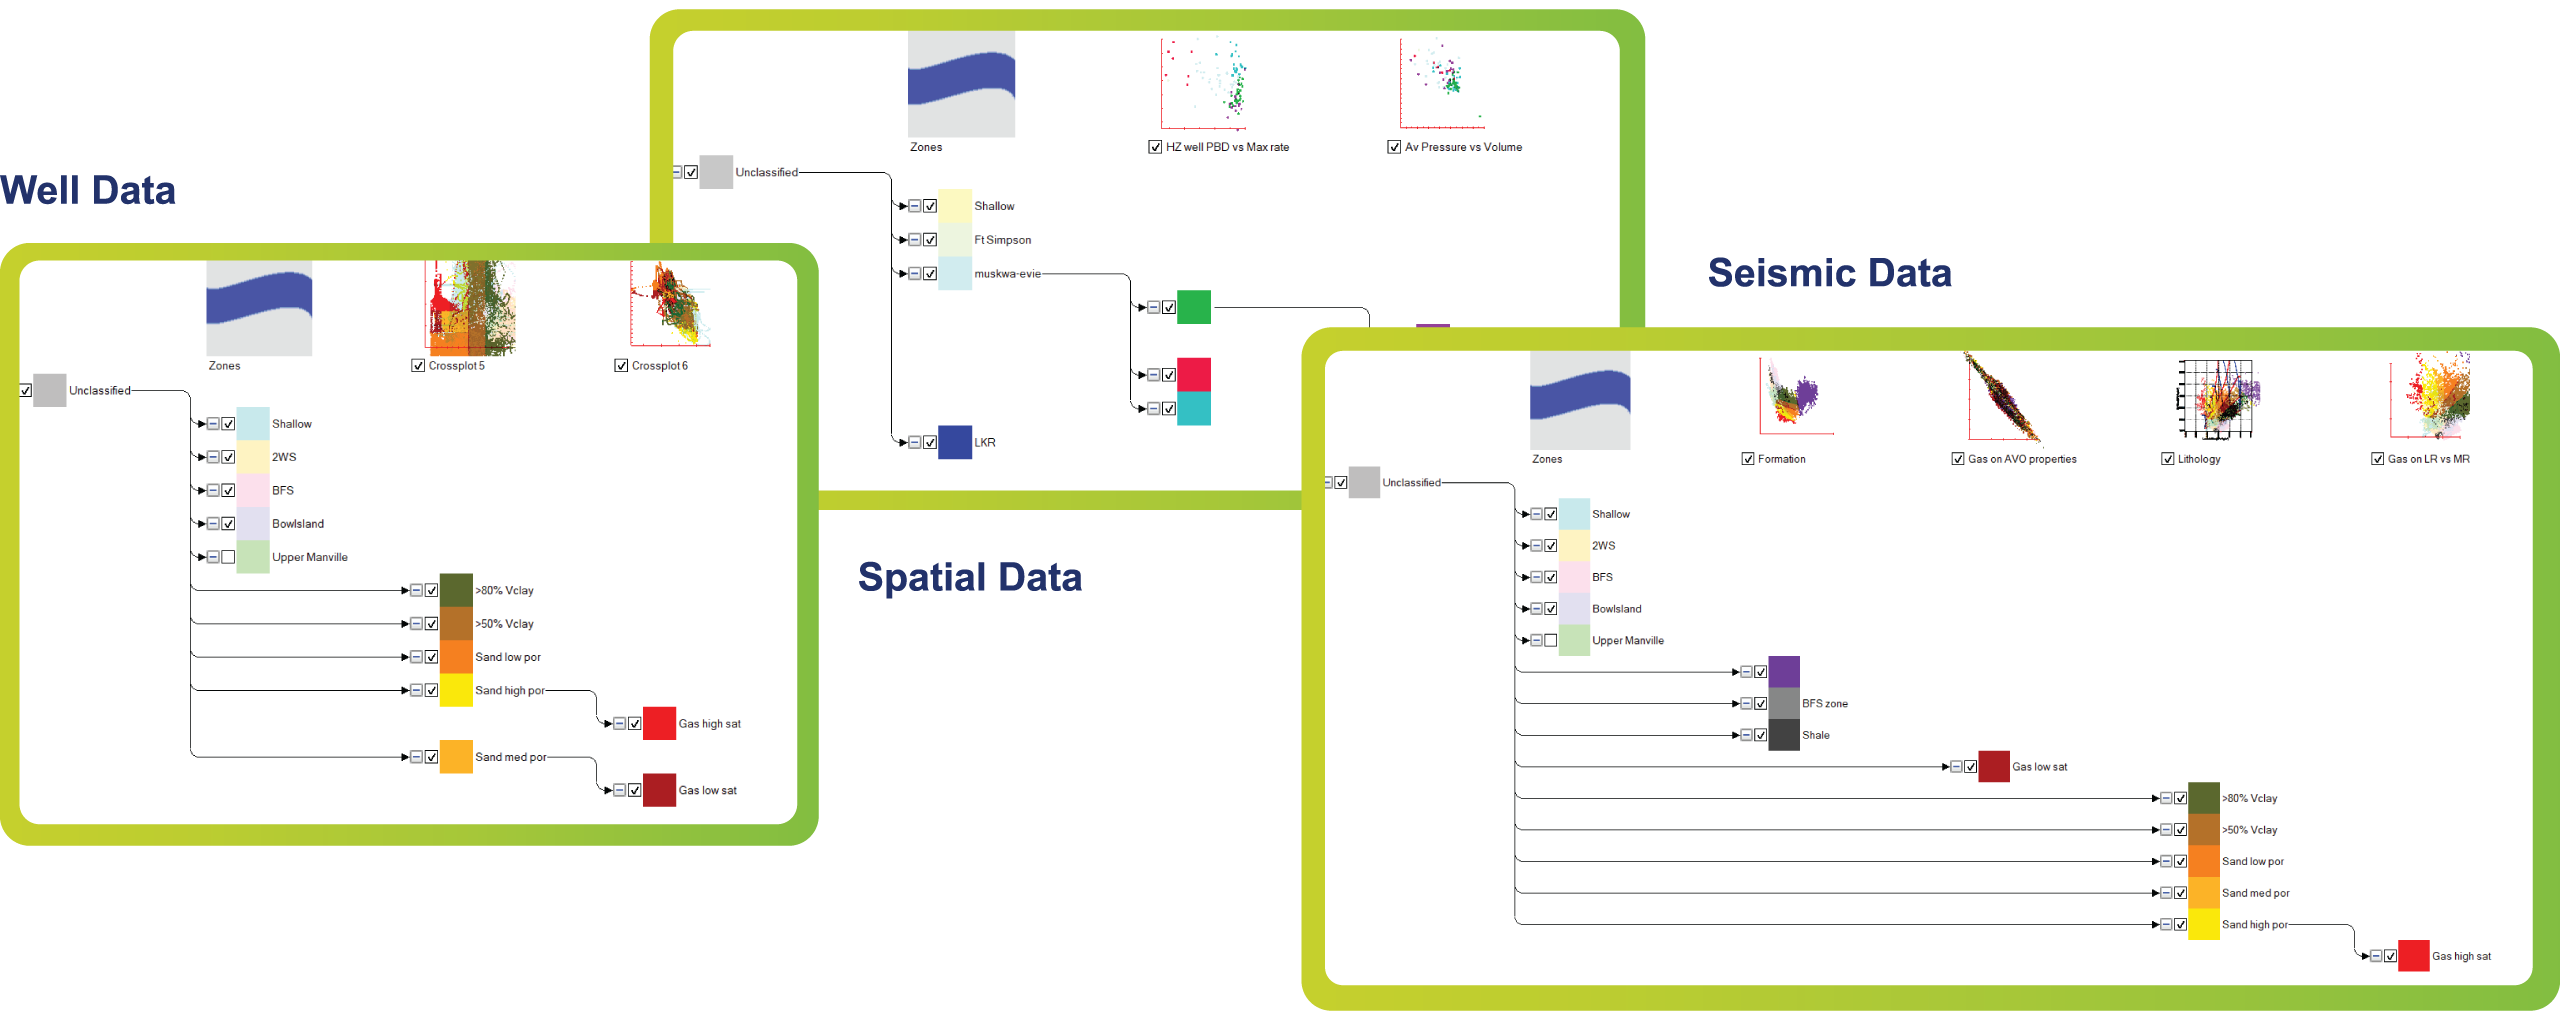
Orchestrate Data
Collect and input available data.
Enhance Understanding
Build a multi-layered workflow in a series of nested crossplots. See the outcomes immediately.
Take a Bow
View, validate, refine, and deliver.
Key Features & Functionality
Employing a systematic approach that incorporates multi-disciplinary input, Maestro provides tools and levers to distill diverse data into insightful representations of key properties. Hover over icons to learn more.
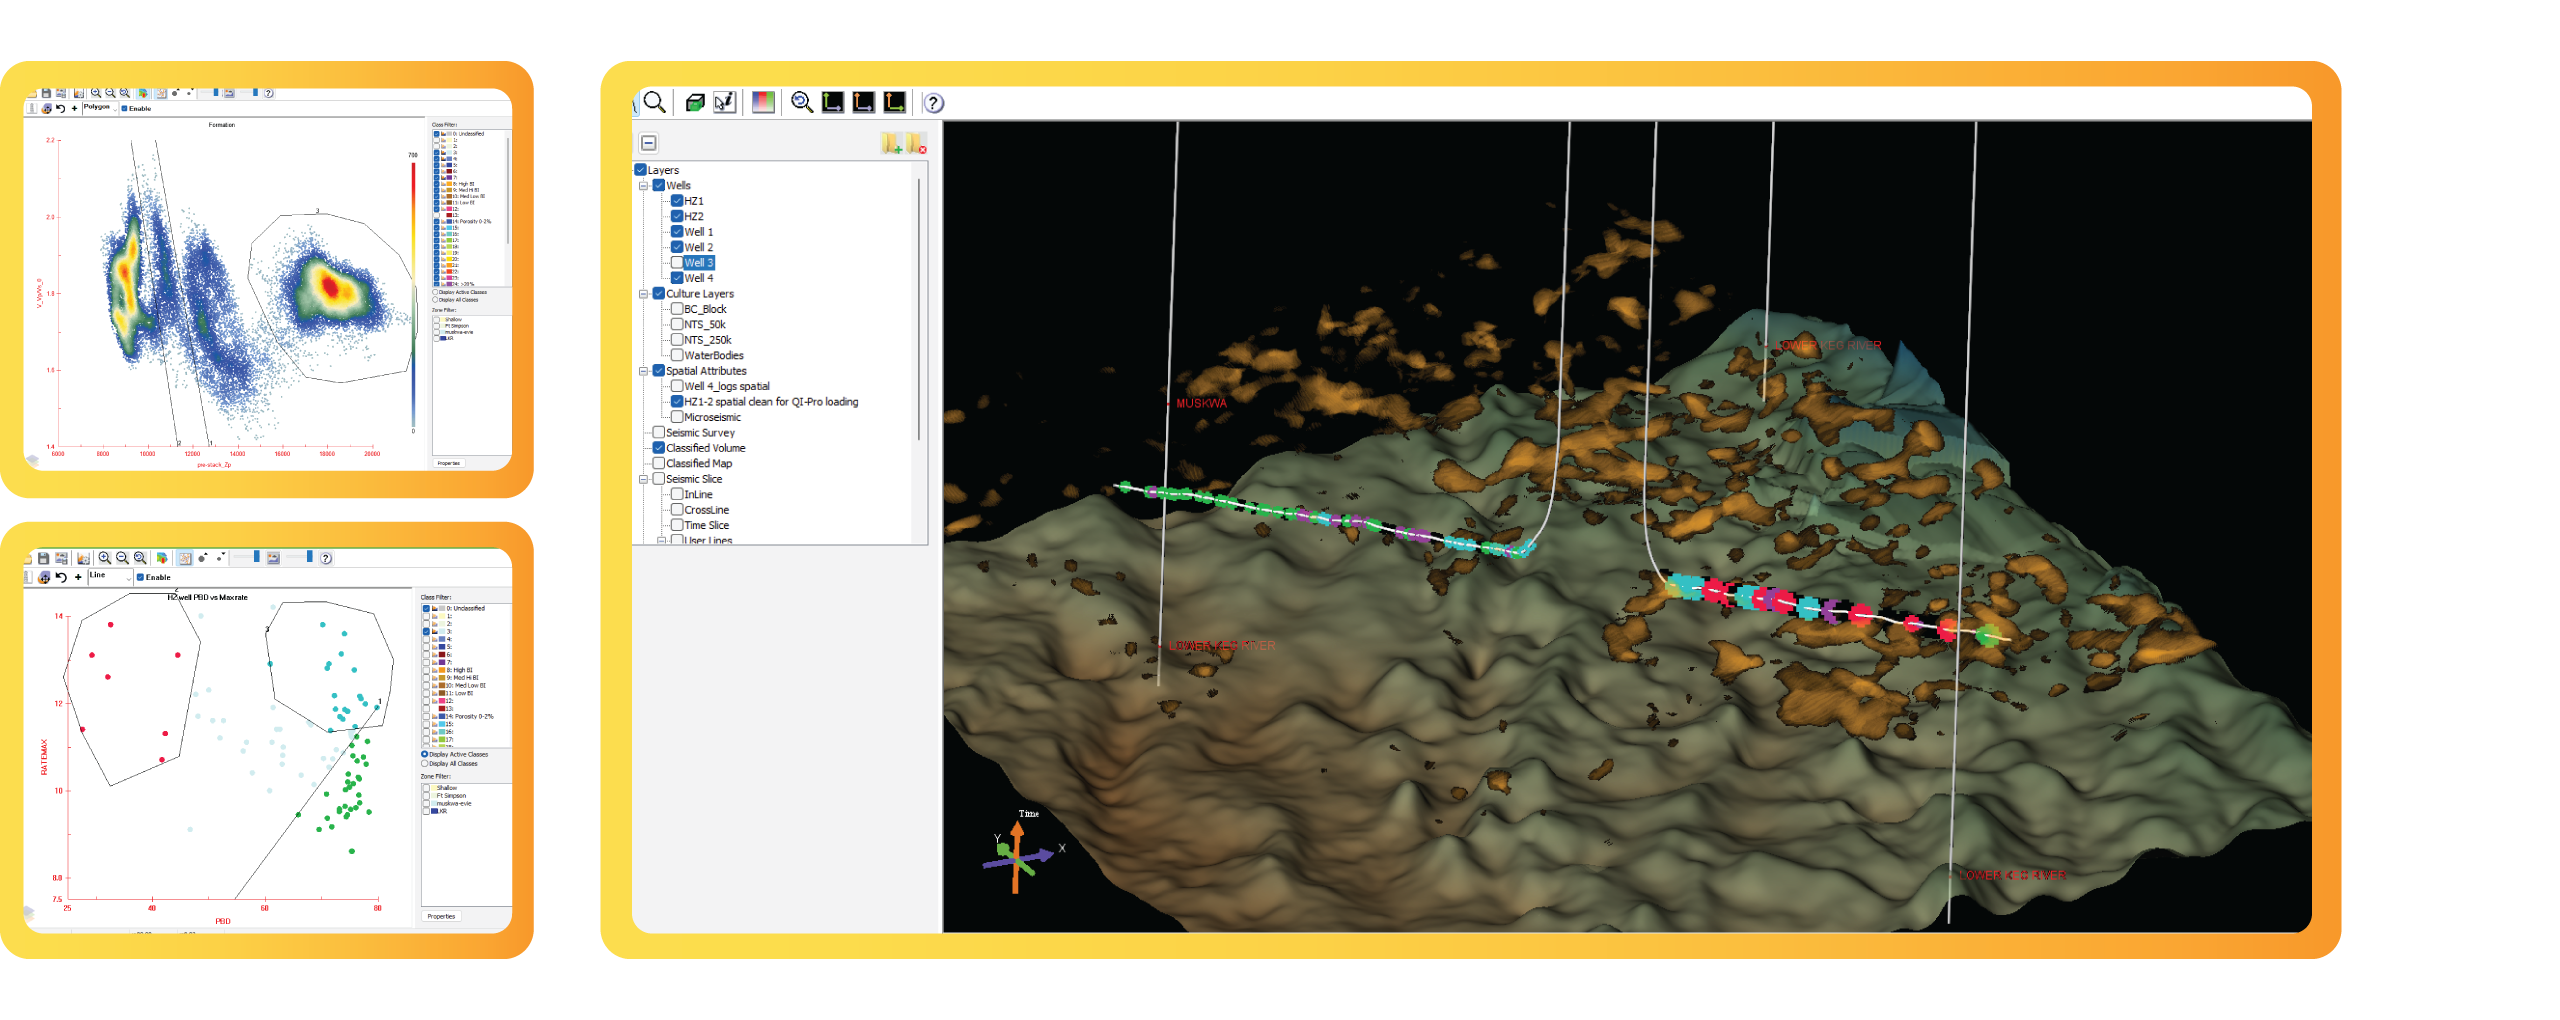
Interactive 3D Visualization
Attribute Scanning for Useful Relationships
Hierarchy of Attribute Criteria
Virtual Attributes for On-The-Fly Computations
Interactive Crossplot Classification
Multiple Data Layers Visualized Interactively
Maestro Key Benefits
Unprecedented Speed of Investigation:
Maestro’s unique visual logic approach reveals meaningful geological insights in minutes or hours, instead of weeks or months. Improve efficiency and accelerate project timelines.
Logical Interface:
Maestro’s intuitive interface lets you navigate your workflow at a glance and easily manipulate criteria to visualize the reservoir from multiple perspectives and priorities. No more dealing with menu after menu of parameter entry and black box algorithms with puzzling outcomes.
Enhanced Modelling. Dynamic Confirmation:
Maestro cross-analyzes data to create the most complete and comprehensive starting point to discover the subsurface truth.
Inter-Disciplinary Data Orchestration:
Multiple data types are integrated into a harmonious platform with ease, highlighting geological features of interest or issue. Validation becomes obvious.
Enhanced Decision Making:
Maestro unlocks a new level of reservoir understanding, which allows teams to make more confident and informed decisions. This is particularly useful in complex, high-risk, high-cost projects where innovative, high-value solutions emerge.
Compare Multi-Attribute Interpretation Capability
You might think you already have tools to do this, but you don’t. Only Maestro can synchronize multiple data attributes with this level of speed, precision and insight.
The Freedom to improvise
Like music, data interpretation is an art form grounded in mathematics.
Maestro amplifies creativity by providing the tools to create your masterpiece guided by data patterns. Draw on your experience, association, and instinct, bounded only by the limits of fundamental scientific reality. Uncover possibilities in record time.
The Performance is About to Begin
Contact us to book an individual or cross-team demo.
Experience the extraordinary power of Maestro to improve reservoir understanding with unparalleled speed, ease, collaboration, and control.
Book a DemoThe Maestro Story
Maestro is an advanced data interpretation platform created by the experienced team of data analysts at Sound QI, based on our proprietary methodology of quantitative data interpretation. We sought a faster, easier and more effective platform for interpreting multiple seismic attributes that are routinely delivered by quantitative interpretation workflows.
Originally developed as a method of visually integrating and interpreting multiple attributes of large seismic datasets, its usefulness for any type of spatial data became immediately apparent.
Our software was initially developed under the name QI-Pro. As the capabilities and applications expanded, we changed the name to Maestro. The best part: it’s not a black AI box. Maestro is fast but combines logic and creativity into a symphony of data and insight.
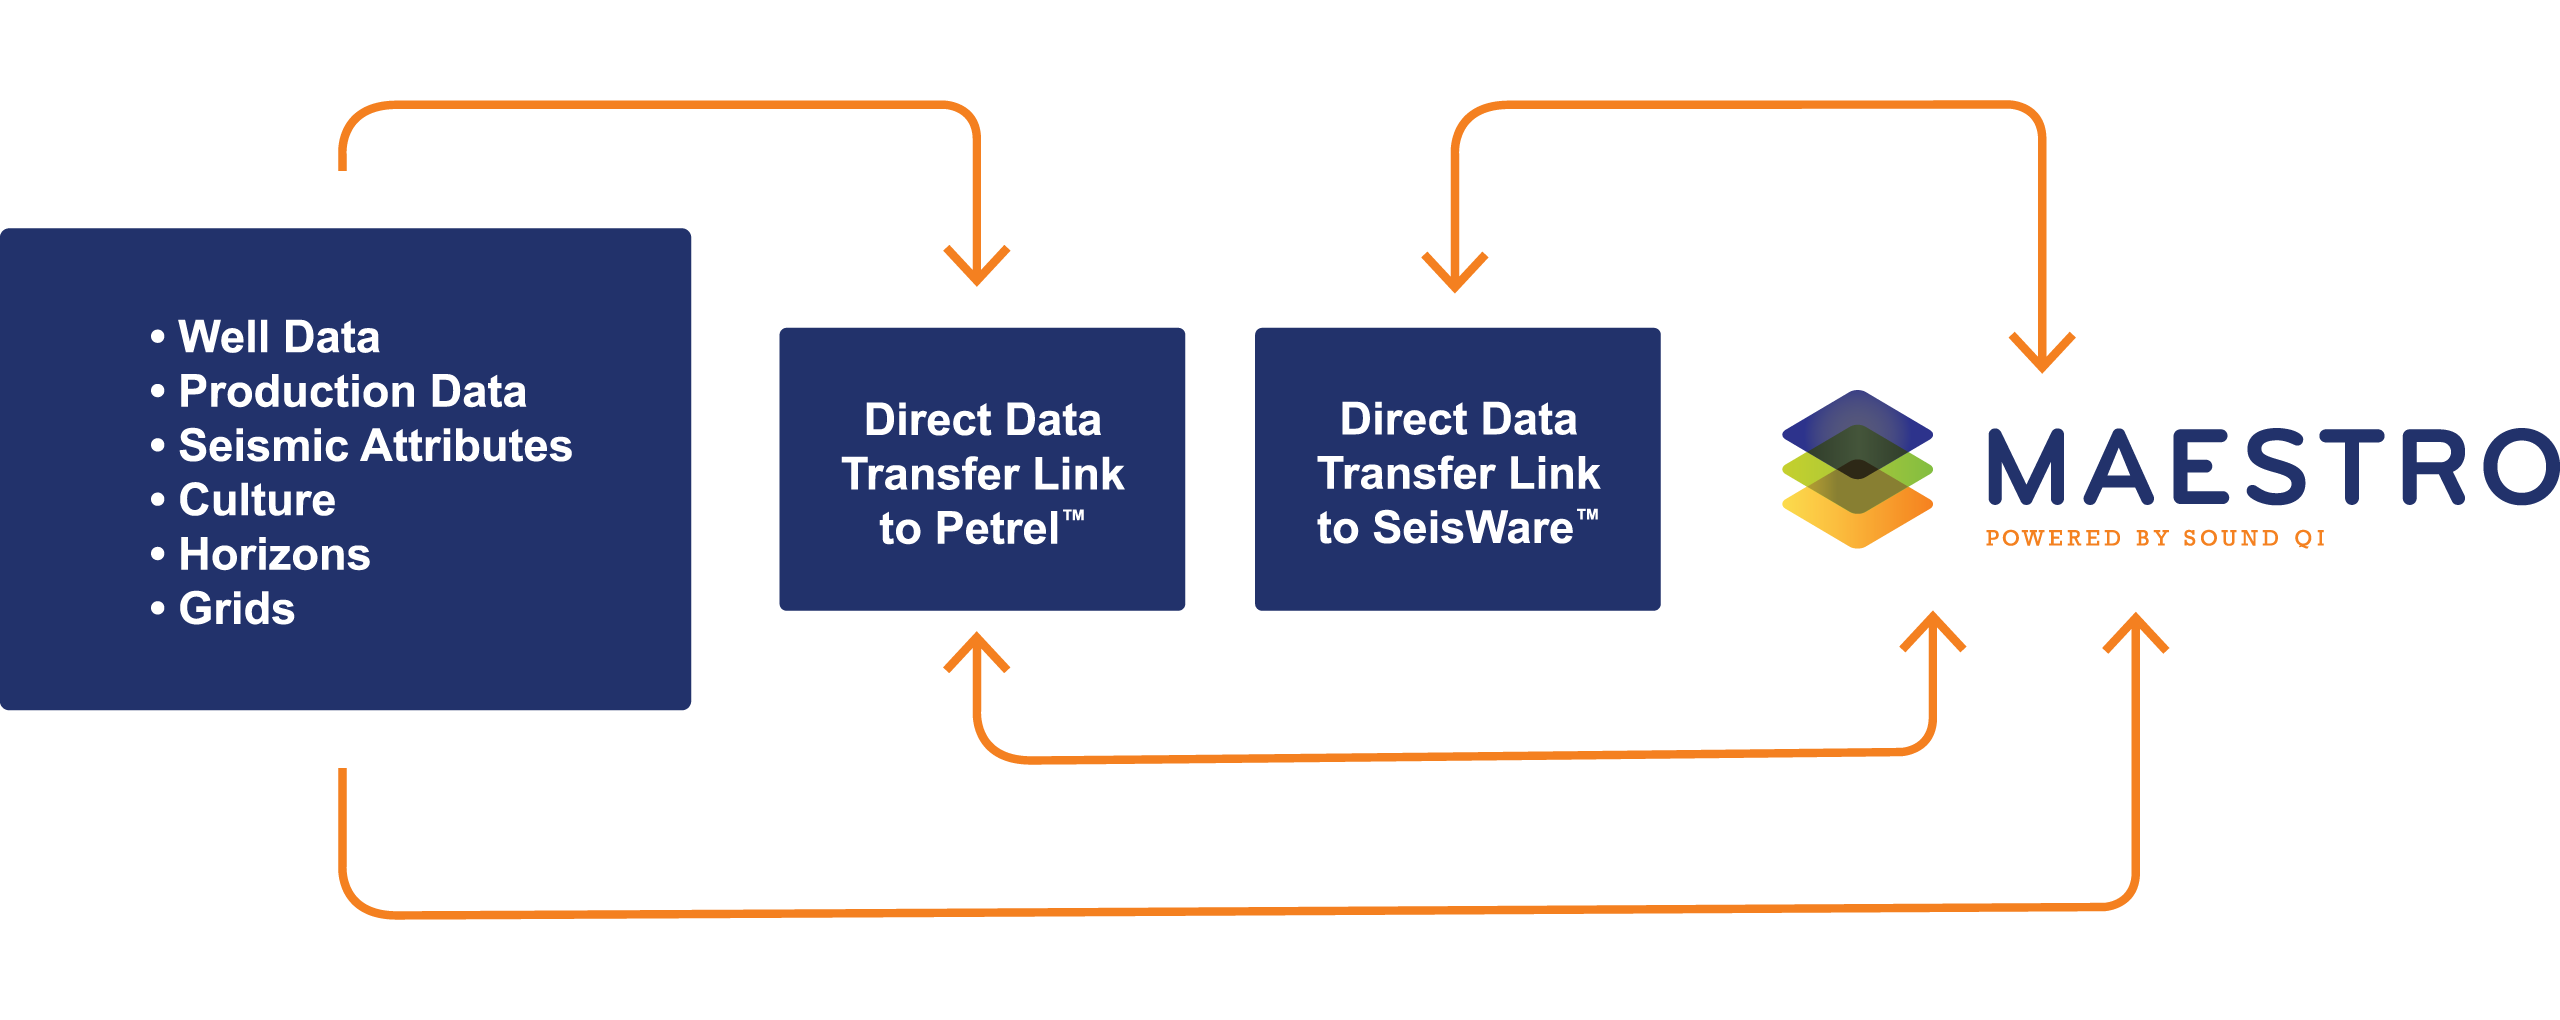
Built with Accompaniment in Mind
Compatible Software and Plug-Ins
Maestro can perform alongside your existing software tools, to provide cross-platform integration.
Upcoming Events
Sound QI will be showcasing Maestro on some of the industry’s largest stages:
Take the Baton.
Book a Demo
Discover the possibilities, contact
us to learn more or book a demo.